Environmental Performance
Energy Consumption
| |
Unit |
2011-12 |
2012-13 |
2013-14 |
2014-15 |
2015-16 |
| Electricity |
GJ |
860,400 |
864,000 |
890,244 |
947,646 |
988,740 |
| (Million kWh) |
(239) |
(240) |
(247) |
(263) |
(275) |
| Pool cars |
GJ |
Figures not available |
1,046.19 |
877.48 |
893.14 |
824.63 |
| (Litre) |
(31,862) |
(26,724) |
(27,048) |
(24,974) |
| AM cars |
GJ |
4,423.79 |
4,315.08 |
4,103.83 |
3,799.29 |
3,496.86 |
| (Litre) |
(133,967) |
(130,675) |
(124,278) |
(115,060) |
(105,901) |
| Biogas1 |
Million m3 |
10 |
10 |
9 |
10 |
10 |
| Average electricity consumption per unit volume of sewage treated (G4-EN5) |
kWh |
0.2426 |
0.2388 |
0.2409 |
0.2591 |
0.2716 |
| Electricity |
GJ |
Figures not available |
137,952 |
23,328 |
97,798 |
| (Million kWh) |
(38.32) |
(6.48) |
(27.17) |
| Gasoline |
GJ |
Figures not available |
13,153 |
10,438 |
6,834 |
| (Litre) |
(398,325) |
(316,101) |
(187,239) |
| Diesel |
GJ |
Figures not available |
94,698 |
27,451 |
42,601 |
| (Litre) |
(2,594,463) |
(752,080) |
(1,167,162) |
Greenhouse Gas (GHG) Emissions2
| |
Unit |
2011-12 |
2012-13 |
2013-14 |
2014-15 |
2015-16 |
| Electricity purchased (Scope 2) (G4-EN16) |
Tonnes CO2 |
167,300 |
168,000 |
173,103 |
184,265 |
187,611 |
| Pool cars |
Tonnes CO2 |
Figures not available |
75.19 |
63.07 |
63.83 |
65.90 |
| AM cars |
Tonnes CO2 |
316.16 |
308.39 |
336.53 |
271.54 |
249.93 |
Electricity purchased
(Scope 3) |
Tonnes CO2e |
Figures not available |
26,824 |
4,536 |
19,016 |
Fuel consumption3
(Scope 3) |
Tonnes CO2e |
Figures not available |
7,865 |
2,824 |
3,561 |
Water Consumption
| |
Unit |
2011-12 |
2012-13 |
2013-14 |
2014-15 |
2015-16 |
| Freshwater consumption at flood prevention and sewage treatment facilities (G4-EN8) |
m3 |
2,092,627 |
2,078,729 |
1,709,925 |
2,085,560 |
2,050,936 |
| Daily reclaimed water produced at STWs |
m3 |
1,349 |
1,194 |
1,151 |
1,565 |
1,512 |
| Percentage of water reclaimed (G4-EN10) |
% |
0.06 |
0.06 |
0.07 |
0.08 |
0.07 |
Sewage Treatment
| |
Unit |
2011-12 |
2012-13 |
2013-14 |
2014-15 |
2015-16 |
| Volume of sewage treated (G4-EN22) |
Million m3 |
981 |
1,001 |
1,021 |
1,011 |
1,007 |
| Biochemical oxygen demand (BOD) removed from sewage |
Tonnes |
107,057 |
100,677 |
109,579 |
115,681 |
124,569 |
| Suspended solids (SS) removed from sewage |
163,986 |
146,208 |
169,792 |
207,738 |
242,933 |
| Nitrogen removed from sewage |
5,541 |
5,310 |
6,067 |
6,820 |
6,551 |
| Dewatered sludge removed from treated sewage |
301,583 |
300,965 |
298,093 |
355,220 |
392,396 |
| Screenings removed from treated sewage |
12,157 |
13,334 |
13,663 |
15,817 |
15,172 |
| Grits removed from treated sewage |
4,388 |
4,741 |
4,903 |
5,429 |
6,631 |
Waste Management (G4-EN23)
| |
Unit |
2011-12 |
2012-13 |
2013-14 |
2014-15 |
2015-16 |
| C&D waste disposed of to landfills4 |
103 kg |
7,863 |
8,525 |
6,093 |
6,420 |
6,998 |
| C&D waste disposed of to public fill areas3 |
103 kg |
854,293 |
765,105 |
584,018 |
238,662 |
235,735 |
| Waste paper5 |
kg |
18,679 |
11,983 |
13,284 |
28,918 |
19,360 |
| Aluminium cans6 |
kg |
12.94 |
14.15 |
14.76 |
30.70 |
19.73 |
| Plastic bottles5 |
kg |
28.53 |
29.92 |
27.78 |
43.70 |
20.71 |
Material consumption (G4-EN1)
| |
Unit |
2011-12 |
2012-13 |
2013-14 |
2014-15 |
2015-16 |
| Total paper consumption |
Reams |
11,870 |
11,054 |
10,520 |
10,012 |
9,608 |
| A4 paper |
Reams |
11,400 |
10,696 |
10,080 |
9,452 |
9,357 |
| A3 paper |
Reams |
470 |
358 |
440 |
470 |
251 |
| Purchased paper with recycled content |
Reams(% of total paper purchased) |
11,850
(99.8%) |
11,054
(100%) |
10,520
(100%) |
10,012
(100%) |
9,608
(100%) |
| Paper consumed per staff (By establishment) |
Reams |
6.4 |
6.0 |
5.6 |
5.3 |
5.0 |
| Rebar |
Tonnes |
Figures not available |
7,165 |
| Steel |
Tonnes |
3,171 |
| Bricks |
m3 |
30 |
| Cement |
Tonnes |
2,406 |
| Cement Mortar |
m3 |
263 |
| Concrete |
m3 |
50,616 |
| Sand |
Tonnes |
12,586 |
| Stones |
Tonnes |
9,617 |
| Office paper |
Tonnes |
27 |
Greening
| |
Unit |
2011-12 |
2012-13 |
2013-14 |
2014-15 |
2015-16 |
| Trees Planted |
No. |
2,500 |
1,996 |
2,169 |
570 |
2,300 |
| Area of Green Roof Added |
m2 |
2,900 |
3,200 |
4,902 |
6,051 |
4,015 |
| Electricity Generated from Biogas |
Million kWh |
27 |
30 |
27 |
28 |
32 |
Social Performance
Staff
| |
Unit |
2011-12 |
2012-13 |
2013-14 |
2014-15 |
2015-16 |
| Staff Establishment |
No. |
1,845 |
1,856 |
1,862 |
1,883 |
1,914 |
| Directorate |
No. |
18 |
18 |
18 |
18 |
18 |
| Professional |
No. |
283 |
292 |
292 |
306 |
310 |
| Technical & Site Supervisory |
No. |
815 |
820 |
827 |
838 |
865 |
| General & Common Grades |
No. |
525 |
525 |
526 |
524 |
526 |
| Model Scale I |
No. |
204 |
201 |
199 |
197 |
195 |
| Training courses7 |
No. |
256 |
278 |
5848 |
624 |
654 |
| Trainees |
No. |
6,978 |
9,848 |
6,574 |
7,159 |
8,019 |
| Training hours received |
Hours |
44,369 |
52,597 |
54,517 |
57,600 |
58,520 |
| Average Training Hours per Staff |
Hours |
24.0 |
28.3 |
31.6 |
31.8 |
33 |
| Total expenditure on training 6 |
HK$ |
4,306,329 |
4,756,800 |
3,856,237 |
4,201,000 |
3,585,011 |
| Staff injury cases 9 |
No. |
14 |
12 |
10 |
11 |
13 |
| No. of sick leave for officers injured on duty |
Days |
920.5 |
1,237 |
603 |
914.5 |
870.510 |
Staff Breakdown in 2015-16
| |
Unit |
By Strength |
| No. of Staff (G4-10) |
No. |
1,761 |
| Directorate |
% |
1.2 |
| Professional |
% |
17.4 |
| Technical & site supervisory |
% |
48.0 |
| General & common grades |
% |
23.5 |
| Model scale I |
% |
10.1 |
| Full-time |
% |
100 |
| Part-time |
% |
0 |
| Permanent (male) |
% |
83.8 |
| Permanent (female) |
% |
16.2 |
| Age 20-29 |
% |
7.7 |
| Age 30-39 |
% |
21.0 |
| Age 40-49 |
% |
24.1 |
| Age 50-59 |
% |
46.1 |
| Age 60 or above |
% |
1.2 |
| Local |
% |
100 |
| Non-local |
% |
0 |
| Male |
% |
83.8 |
| Female |
% |
16.2 |
Senior Management Breakdown in 2015-16
| |
Unit |
By Strength |
| No. of Staff |
No. |
7 |
| Age 20-29 |
% |
0 |
| Age 30-39 |
% |
0 |
| Age 40-49 |
% |
14.3 |
| Age 50-59 |
% |
85.7 |
| Age 60 or above |
% |
0 |
| Local |
% |
100 |
| Non-local |
% |
0 |
| Male |
% |
100 |
| Female |
% |
0 |
Training Hours Breakdown in 2015-1611
| Type of Staff |
No. of Staff |
Training Hours Received(Hours) |
Training Hours Per Staff(Hours) |
| Directorate Staff |
20 |
1,267 |
63.3 |
| Professional Grade Staff |
306 |
23,541 |
76.9 |
| Technical, Site Supervisory, General Grade and Model Scale I Staff |
1,445 |
33,712 |
23.3 |
Staff Turnover in 2015-1612
| |
Unit |
Male |
Female |
| Age 20-29 |
No. |
0 |
0 |
| Age 30-39 |
No. |
1 |
0 |
| Age 40-49 |
No. |
0 |
0 |
| Age 50-59 |
No. |
4 |
4 |
| Age 60 or above |
No. |
52 |
5 |
New Employee Hires in 2015-1613
| |
Unit |
Male |
Female |
| No. of New Employee Hires |
No. |
88 |
12 |
| Age 20-29 |
No. |
39 |
7 |
| Age 30-39 |
No. |
35 |
5 |
| Age 40-49 |
No. |
9 |
0 |
| Age 50-59 |
No. |
5 |
0 |
| Age 60 or above |
No. |
0 |
0 |
Accident Rate (G4-LA6)
| |
Unit |
2011-12 |
2012-13 |
2013-14 |
2014-15 |
2015-16 |
| No. of Fatalities |
No. |
1 |
0 |
2 |
0 |
1 |
| Construction and maintenance works carried out directly by DSD's staff |
No. |
0 |
0 |
0 |
0 |
0 |
| Construction and maintenance works undertaken by DSD's contractors |
No. |
1 (Male) |
0 |
2 (Male) |
0 |
1 (Male) |
| Construction and maintenance works carried out directly by DSD's staff14 |
- |
0 |
0 |
0 |
0 |
0 |
| Construction and maintenance works undertaken by DSD's contractors13 |
- |
0.005 |
0 |
0.012 |
0 |
0.011 |
| Construction and maintenance works carried out directly by DSD's staff13 |
No. |
14 |
12 |
10 |
11 |
13 |
| Construction and maintenance works undertaken by DSD's contractors13 |
No. |
64 |
36 |
33 |
18 |
14 |
| Construction and maintenance works carried out directly by DSD's staff13 |
- |
0.21 |
0.18 |
0.15 |
0.17 |
0.20 |
| Construction and maintenance works undertaken by DSD's contractors13 |
- |
0.34 |
0.19 |
0.21 |
0.13 |
0.16 |
Community Work and Charitable Contributions (G4-EC8)
| |
Unit |
2011-12 |
2012-13 |
2013-14 |
2014-15 |
2015-16 |
| Total number of voluntary work hours carried out by our staff |
Hours |
469 |
589 |
800 |
1,000 |
1,200 |
| Number of voluntary projects completed |
No. |
14 |
18 |
21 |
25 |
27 |
| Employee fundraising |
HK$ thousands |
133 |
56 |
67 |
73 |
65 |
Economic Performance
The two major types of expenses in DSD are operational expenses and public works project expenses. Our day-to-day departmental operation is financed by the General Revenue Account of the Government, while funding for public works projects are approved on a project-by-project basis by the Finance Committee of the Legislative Council. To ensure public funds are used effectively, we strive to enhance operation efficiency by adopting new technologies and management practices.
Operating Expenditure (G4-EC1)
| |
Unit |
2011-12 |
2012-13 |
2013-14 |
2014-15 |
2015-16 |
| Recurrent Expenditure |
Personal Emoluments |
$M |
727.4 |
769.3 |
793.5 |
839.8 |
882.3 |
| Departmental Expenses15 |
$M |
1,111.2 |
1,141.4 |
1,178.9 |
1,286.4 |
1,487.8 |
| Non-recurrent Expenditure |
$M |
0.0 |
0.0 |
0.0 |
0.0 |
0.0 |
| Total |
$M |
1,838.6 |
1,910.7 |
1,972.4 |
2,126.2 |
2,370.1 |
Capital Works Project Expenditure
| |
Unit |
2011-12 |
2012-13 |
2013-14 |
2014-15 |
2015-16 |
| Value of drainage projects under planning, design and construction |
$M |
14,323 |
11,288 |
12,311 |
12,975 |
13,983 |
| Value of sewerage projects under planning, design and construction |
$M |
41,200 |
49,872 |
78,749 |
80,483 |
72,402 |
| No. of drainage projects under planning, design and construction |
No. |
22 |
20 |
20 |
17 |
18 |
| No. of sewerage projects under planning, design and construction |
No. |
70 |
77 |
87 |
81 |
73 |
Sewage Services Operating Accounts
| |
Unit |
2011-12 |
2012-13 |
2013-14 |
2014-15 |
2015-1616 |
| Sewage Charge Revenue |
$M |
703 |
776 |
875 |
955 |
1,048 |
| Trade Effluent Surcharge Revenue |
$M |
204 |
207 |
221 |
226 |
232 |
| Other Revenue |
$M |
40 |
40 |
44 |
45 |
47 |
| Overall Revenue |
$M |
947 |
1,023 |
1,141 |
1,227 |
1,327 |
| Expenditure (excluding depreciation) |
$M |
(1,484) |
(1,538) |
(1,594) |
(1,759) |
(1,927) |
| Depreciation |
$M |
(782) |
(801) |
(850) |
(840) |
(1,045) |
| Overall Expenditure |
$M |
(2,266) |
(2,339) |
(2,444) |
(2,599) |
(2,972) |
| (Deficit) |
$M |
(1,319) |
(1,316) |
(1,303) |
(1,372) |
(1,645) |
Sewage Services Operating Cost Recovery Rate
| |
Unit |
2014-15 |
2015-16 |
| Revenue of Sewage Charge and Trade Effluent Surcharge |
$M |
1,182 |
1,280 |
| Expenditure (excluding depreciation) of Sewage Charge and Trade Effluent Surcharge |
$M |
1,715 |
1,881 |
| Operating Cost Recovery Rate |
% |
68.9 |
68.0 |
Sewage Service Charge Consumption and Payment Statistics
| |
2011-12 |
2012-13 |
2013-14 |
2014-15 |
2015-16 |
| Number of water accounts (in thousand) |
2,800 |
2,820 |
2,860 |
2,881 |
2,907 |
| Number of water accounts liable to pay sewage charge (in thousand) |
2,590 |
2,610 |
2,640 |
2,663 |
2,689 |
| Number of Accounts - Trade Effluent Surcharge (TES) (in thousand) |
21.4 |
22 |
23 |
24 |
25 |
Routine Services
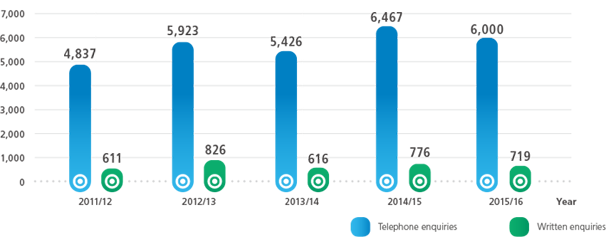
Number of Enquiries Received for the Past Five Years
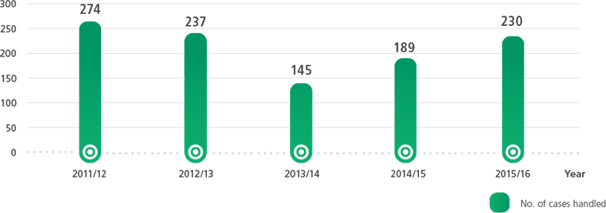
Business Reclassification Applications Handled for the Past Five Years
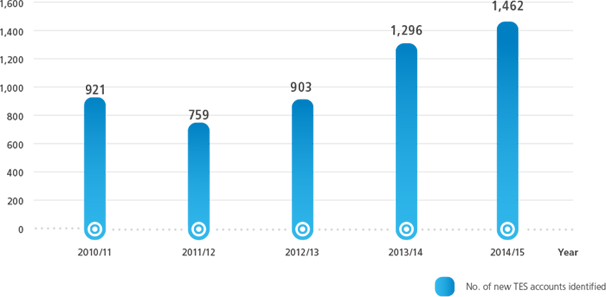
Number of New TES Accounts Identified for the Past Five Years
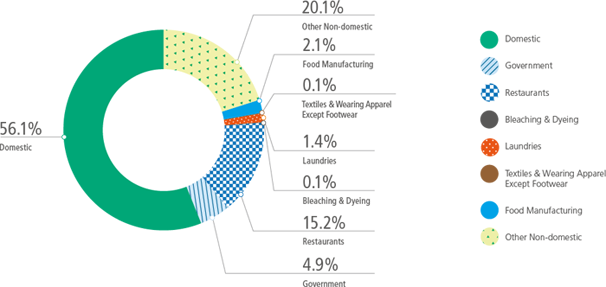
Water Consumption of Sewered Accounts ($524 million m3) - Customers Pattern in 2015-16
Domestic Accounts - Sewage Charge Payment Pattern in 2015-16 (HK$/month)
TES Accounts - TES Payment Pattern in 2015-16 (HK$/month)
Sewage Charge (HK$1,048 M) - Revenue Pattern by Type in 2015-1617
Trade Effluent Surcharge (HK$232 M) - Revenue Pattern by Type in 2015-1617
Sewage Charge and Trade Effluent Surcharge (HK$1,280 M) - Revenue Pattern by Type in 2015-1617
| |
Unit |
2011-12 |
2012-13 |
2013-14 |
2014-15 |
2015-16 |
| Total number of flooding blackspots |
No. |
15 |
13 |
11 |
10 |
8 |
| Coverage of public sewerage (population percentage)18 |
- |
93% |
93% |
93% |
93% |
93% |
| Total length of sewerage network |
km |
1,647 |
1,683 |
1,695 |
1,700 |
1,700 |
| Total no. of sewage treatment facilities |
No. |
287 |
292 |
293 |
297 |
300 |
| Volume of sewage treated |
Million m3 |
981 |
1,001 |
1,021 |
1,011 |
1,007 |
| By Preliminary Treatment |
286 |
306 |
303 |
228 |
138 |
| By Primary Treatment |
4 |
5 |
5 |
5 |
5 |
| By Chemically Enhanced Primary Treatment (CEPT) |
525 |
525 |
541 |
606 |
690 |
| By Secondary Treatment |
166 |
165 |
172 |
172 |
174 |
| By Tertiary Treatment |
0.13 |
0.2 |
0.15 |
0.14 |
0.14 |


