Environmental Performance
Electricity Consumption
| Unit | 2009-10 | 2010-11 | 2011-12 | 2012-13 | 2013-14 | |
|---|---|---|---|---|---|---|
| Total electricity consumption by DSD (1) | million kWh | 241 | 240 | 239 | 240 | 247 |
| Total energy consumption equivalent to electricity consumption by DSD | GJ | 867,600 | 864,000 | 860,400 | 864,000 | 890,244 |
| Total CO2 emission equivalent to total electricity consumption by DSD (2) | Tonnes CO2e | 168,700 | 168,000 | 167,300 | 168,000 | 173,103 |
| Average electricity consumption per unit volume of sewage treated | kWh | 0.2451 | 0.2431 | 0.2426 | 0.2388 | 0.2409 |
| Volume of biogas generated from sewage treatment works | million m3 | 10 | 9 | 10 | 10 | 9 |
| Unit | 2009-10 | 2010-11 | 2011-12 | 2012-13 | 2013-14 | |||||
|---|---|---|---|---|---|---|---|---|---|---|
| Electricity consumption outside of the organization (e.g. energy used by DSD’s contractors) | million kWh | Figures not available | 38.32 | |||||||
| Total fuel consumption by contract cars (excluding DSD's pool cars) | Litre | Figures not available | 398,325 | |||||||
| Total CO2 emission equivalent to total energy consumption by DSD’s contractors (2) | Tonnes CO2e | Figures not available | 34,689 | |||||||
| (1) | The total electricity consumption in 2009/10 did not include the office at Western Magistracy as the data were not available. |
|---|---|
| (2) | Territory wide default GHG emission factors (0.7) were used based on the Guidelines to Account for and Report on Greenhouse Gas Emissions and Removals for buildings (Commercial, Residential or Institutional Purpose) in Hong Kong issued by the Environmental Protection Department, HKSAR in February 2010. |
Water Consumption
| Unit | 2009-10 | 2010-11 | 2011-12 | 2012-13 | 2013-14 | |
|---|---|---|---|---|---|---|
| Freshwater consumption at flood prevention and sewage treatment facilities | m3 | 1,724,983 | 1,790,088 | 2,092,627 | 2,078,729 | 1,709,925 |
| Daily reclaimed water produced at STWs | m3 | 202 | 1,337 | 1,349 | 1,194 | 1,151 |
| Percentage of water reclaimed | % | 0.01% | 0.07% | 0.06% | 0.06% | 0.07% |
Sewage Treatment
| Unit | 2009-10 | 2010-11 | 2011-12 | 2012-13 | 2013-14 | |
|---|---|---|---|---|---|---|
| Volume of sewage treated | million m3 | 979 | 979 | 981 | 1,001 | 1,021 |
| Biochemical oxygen demand (BOD) removed from sewage | Tonnes | 106,131 | 126,451 | 107,057 | 100,677 | 109,579 |
| Suspended solids (SS) removed from sewage | 144,386 | 159,265 | 163,986 | 146,208 | 169,792 | |
| Nitrogen removed from sewage | 5,430 | 5,317 | 5,541 | 5,310 | 6,067 | |
| Dewatered sludge removed from treated sewage | 285,759 | 297,638 | 301,583 | 300,965 | 298,093 | |
| Screenings removed from treated sewage | 12,583 | 12,379 | 12,157 | 13,334 | 13,663 | |
| Grits removed from treated sewage | 4,930 | 5,090 | 4,388 | 4,741 | 4,903 |
Fuel Consumption
| Unit | 2009-10 | 2010-11 | 2011-12 | 2012-13 | 2013-14 | |
|---|---|---|---|---|---|---|
| Total fuel consumption by DSD's pool cars | Litre | Figures not available | 31,862 | 26,724 | ||
| Total fuel consumption by DSD's AM cars | Litre | 104,170 (4) | 96,407 (4) | 133,967 | 130,675 | 124,278 |
| No. of DSD's pool cars | No. | Figures not available | 12.42 | 11.30 | ||
| No. of DSD's AM cars | No. | 58.40 | 57.39 | 53.00 | 52.10 | 48.82 |
| Total energy consumption equivalent to total fuel consumption by DSD's pool cars | GJ | Figures not available | 1046.19 | 877.48 | ||
| Total energy consumption equivalent to total fuel consumption by DSD's AM cars | GJ | 3439.85 | 3183.50 | 4423.79 | 4315.08 | 4103.83 |
| Total GHG emission equivalent to total fuel consumption by DSD's pool cars (3) | Tonnes CO2e | Figures not available | 75.19 | 63.07 | ||
| Total GHG emission equivalent to total fuel consumption by DSD's AM cars (3) | Tonnes CO2 | 245.84 | 227.52 | 316.16 | 308.39 | 336.53 |
| (3) | GHG emission factors for mobile combustion are based on the Guidelines to Account for and Report on Greenhouse Gas Emissions and Removals for buildings (Commercial, Residential or Institutional Purpose) in Hong Kong issued by the Environmental Protection Department, HKSAR in February 2010. |
|---|---|
| (4) | The number of AM cars of Mainland South Division and Mainland North Division were excluded as the records were not available. |
Paper Consumption
| Unit | 2009-10 | 2010-11 | 2011-12 | 2012-13 | 2013-14 | |
|---|---|---|---|---|---|---|
| Total paper consumption | Reams | 14,014 | 12,996 | 11,870 | 11,054 | 10,520 |
| A4 paper consumption | Reams | 13,396 | 12,455 | 11,400 | 10,696 | 10,080 |
| A3 paper consumption | Reams | 618 | 541 | 470 | 358 | 440 |
| Purchase of A4/A3 paper with recycled content | Reams / % of total paper purchased | 13,854 / 98.9% | 12,921 / 99.4% | 11,850 / 99.8% | 11,054 / 100% | 10,520 / 100% |
| Waste paper collected | kg | 17,480 | 18,539 | 14,994 | 11,900 | 13,284 |
| Paper consumed per staff (By establishment) (The establishment as at March of each financial year was used (e.g. 1.3.2009, 1.3.2010)) |
Reams | 7.5 | 7.0 | 6.4 | 6.0 | 5.6 |
Waste Management
| Unit | 2009-10 | 2010-11 | 2011-12 | 2012-13 | 2013-14 | |
|---|---|---|---|---|---|---|
| Construction & demolition materials | ||||||
| C&D waste disposed of to landfills | 103 kg | 6,529 | 6,877 | 7,863 | 8,525 | 6,093 |
| C&D waste disposed of to public fill areas | 103 kg | 275,754 | 745,234 | 854,293 | 765,105 | 584,018 |
| Recyclable waste collected | ||||||
| Waste paper (5) | kg | 15,372 | 14,978 | 18,679 | 11,983 | 13,284 |
| Aluminium cans (6) | kg | 11.12 | 12.92 | 12.94 | 14.15 | 14.76 |
| Plastic bottles (6) | kg | 18.13 | 27.68 | 28.53 | 29.92 | 27.78 |
| (5) | The amount of waste paper collected did not include the project sites. |
|---|---|
| (6) | The amount of aluminium cans and plastic bottles collected did not include the Kowloon Government Offices and Western Magistracy as the data were not available. |
Environmental Convictions of Contractors
| Unit | 2009-10 | 2010-11 | 2011-12 | 2012-13 | 2013-14 | |
|---|---|---|---|---|---|---|
| Convictions | No. | 2 | 0 | 1 | 4 | 2 |
| Monetary value of significant fines | HK$ | 9,000 | 0 | 4,000 | 56,000 | 28,000 |
Greening
| Unit | 2009-10 | 2010-11 | 2011-12 | 2012-13 | 2013-14 | |
|---|---|---|---|---|---|---|
| Total number of Trees Planted | No. | 1,600(7) | 1,200 | 2,500 | 1,996 | 2,169 |
| Area of Green Roof Added | m2 | 1,200 | 1,200 | 2,900 | 3,200 | 4,902 |
| Electricity Generated from Biogas | in million kWh | 24 | 25 | 27 | 30 | 26 |
| (7) | by end of 2009 |
|---|
Chemicals consumption in CEPT Plants in 2013-14
| Sham Tseng STW | Siu Ho Wan STW | Stonecutters Island STW | |
|---|---|---|---|
| Anionic Polymer (kg) | 957 | 4,896 | 42,390 |
| Ferric Chloride (ton) | 0 | 674 | 15,400 |
| Alum solution (ton) | 891 | 0 | 0 |
Social Performance
Staff
| Unit | 2009-10 | 2010-11 | 2011-12 | 2012-13 | 2013-14 | |
|---|---|---|---|---|---|---|
| Staff Establishment | No. | 1,859 | 1,847 | 1,845 | 1,856 | 1,862 |
| Directorate | No. | 18 | 18 | 18 | 18 | 18 |
| Professional | No. | 276 | 280 | 283 | 292 | 292 |
| Technical & Site Supervisory | No. | 805 | 808 | 815 | 820 | 827 |
| General & Common Grades | No. | 542 | 533 | 525 | 525 | 526 |
| Model Scale I | No. | 218 | 208 | 204 | 201 | 199 |
| Training | ||||||
| No. of training courses (including internal and external seminars/ workshops/ training courses/ visits) | No. | 323 | 219 | 256 | 278 | 584 (8) |
| Numbers of trainees | No. | 6,009 | 6,745 | 6,978 | 9,848 | 6,574 |
| Training hours received | Hours | 43,285 | 42,793 | 44,369 | 52,597 | 54,517 |
| Average training hours per staff | Hours | 23.3 | 23.2 | 24.0 | 28.3 | 31.6 |
| Total expenditure on training (including internal and external seminars/ workshops/ training courses/ visits) | HK$ | 2,888,974 | 3,394,224 | 4,306,329 | 4,756,800 | 3,856,237 |
| Injury | ||||||
| Staff injury cases (9) | No. | 11 | 24 | 14 | 12 | 10 |
| No. of sick leave for officers injured on duty | Days | 313 | 921.5 | 920.5 | 1,237 | 603 (10) |
| (8) | It includes training courses held by CSTDI and staff-initiated external courses. |
|---|---|
| (9) | The definition of staff injury cases is the reported cases of occupational injuries, under Employee’s Compensation Ordinance, resulting in death or incapacity for work over 3 days. |
| (10) | The number includes sick leave days granted in 2012/13 but enjoyed in 2013/14. |
Staff Breakdown (2013-14)
| Unit | 2013-14 By Strength | |
|---|---|---|
| No. of Staff | No. | 1,727 |
| By Post | ||
| Directorate | % | 1.04 |
| Professional | % | 16.91 |
| Technical & site supervisory | % | 46.21 |
| General & common grades | % | 27.10 |
| Model scale I | % | 8.74 |
| By Employment Type | ||
| Full-time | % | 100 |
| Part-time | % | 0 |
| By Employment Contract | ||
| Permanent (male) | % | 84.02 |
| Permanent (female) | % | 15.98 |
| By Age | ||
| Age 20-29 | % | 4.86 |
| Age 30-39 | % | 20.44 |
| Age 40-49 | % | 26.23 |
| Age 50-59 | % | 47.66 |
| Age 60 or above | % | 0.81 |
| By Ethnicity | ||
| Local | % | 100 |
| Non-local | % | 0 |
| By Gender | ||
| Male | % | 84.02 |
| Female | % | 15.98 |
Senior Management Breakdown (2013-14)
| Unit | 2013-14 By Strength | |
|---|---|---|
| No. of Staff | No. | 7 |
| By Age | ||
| Age 20-29 | % | 0 |
| Age 30-39 | % | 0 |
| Age 40-49 | % | 0 |
| Age 50-59 | % | 100 |
| Age 60 or above | % | 0 |
| By Ethnicity | ||
| Local | % | 100 |
| Non-local | % | 0 |
| By Gender | ||
| Male | % | 100 |
| Female | % | 0 |
Training Hours Breakdown (2013-14) (11)
| Type of Staff | No. of Staff | Training Hours Received(Hours) | Training Hours Per Staff(Hours) |
|---|---|---|---|
| Directorate Staff | 18 | 2,043 | 113.48 |
| Professional Grade Staff | 292 | 25,032 | 85.73 |
| Technical, Site Supervisory and General Grade Staff | 1,417 | 27,442 | 19.37 |
| (11) | As there is no distinct requirement regarding receiving training in terms of gender, therefore we do not report the data broken down by gender. |
|---|
Staff Turnover (2013-14) (12)
| Unit | Male | Female | |
|---|---|---|---|
| Age 20-29 | No. | 0 | 1 |
| Age 30-39 | No. | 1 | 0 |
| Age 40-49 | No. | 1 | 1 |
| Age 50-59 | No. | 10 | 4 |
| Age 60 or above | No. | 49 | 5 |
| (12) | The staff turnover figures exclude those General/Common Grades’ staff on inter-department transfer. |
|---|
New Employee Hires (2013-14) (13)
| Unit | Male | Female | |
|---|---|---|---|
| Total no. of New Employee Hires | No. | 108 | 33 |
| By Age | |||
| Age 20-29 | No. | 43 | 16 |
| Age 30-39 | No. | 54 | 13 |
| Age 40-49 | No. | 9 | 2 |
| Age 50-59 | No. | 2 | 2 |
| Age 60 or above | No. | 0 | 0 |
| (13) | The above figures involve staff (position as at 31 March 2014) with their 1st appointment date falling within the period from 1 April 2013 to 31 March 2014. |
|---|
Accident Rate
| Unit | 2009-10 | 2010-11 | 2011-12 | 2012-13 | 2013-14 | |
|---|---|---|---|---|---|---|
| Number of fatalities | ||||||
| Total no. of fatalities | No. | 0 | 0 | 1 | 0 | 2 |
| Construction and maintenance works carried out directly by DSD's staff | No. | 0 | 0 | 0 | 0 | 0 |
| Construction and maintenance works undertaken by DSD's contractors | No. | 0 | 0 | 1 (Male) | 0 | 2 (Male) |
| Fatal accident rate per 100,000 man-hours | ||||||
| Construction and maintenance works carried out directly by DSD's staff | - | 0 | 0 | 0 | 0 | 0 |
| Construction and maintenance works undertaken by DSD's contractors | - | 0 | 0 | 0.005 | 0 | 0.012 |
| Number of non-fatal accidents | ||||||
| Construction and maintenance works carried out directly by DSD's staff | No. | 11 | 24 | 14 | 12 | 10 |
| Construction and maintenance works undertaken by DSD's contractors | No. | 46 | 59 | 64 | 36 | 33 |
| Non-fatal accident rate per 100,000 man-hours | ||||||
| Construction and maintenance works carried out directly by DSD's staff | - | 0.16 | 0.35 | 0.21 | 0.18 | 0.15 |
| Construction and maintenance works undertaken by DSD's contractors | - | 0.34 | 0.38 | 0.34 | 0.19 | 0.21 |
Community Work
| Unit | 2009-10 | 2010-11 | 2011-12 | 2012-13 | 2013-14 | |
|---|---|---|---|---|---|---|
| Total number of voluntary work hours carried out by our staff | Hours | 943.8 | 230 | 469 | 589 | 800 |
| Number of voluntary projects completed | No. | 8 | 10 | 14 | 18 | 21 |
Charitable Contributions
| Unit | 2009-10 | 2010-11 | 2011-12 | 2012-13 | 2013-14 | |
|---|---|---|---|---|---|---|
| Employee fundraising | (HK$ thousands) | 83 | 136 | 133 | 56 | 67 |
Legal Compliance
| Unit | 2009-10 | 2010-11 | 2011-12 | 2012-13 | 2013-14 | |
|---|---|---|---|---|---|---|
| Convicted cases of corruption | No. | 0 | 0 | 1 | 0 | 1 |
Remuneration
| Unit | 2013-14 | |
|---|---|---|
| Ratio of percentage increase in annual total compensation for the organization’s highest-paid individual to the median percentage increase in annual total compensation for all employees (excluding the highest-paid individual) | N/A | 1:1.54 |
Economic Performance
Sewage Service Charge Consumption and Payment Statistics
| 2009-10 | 2010-11 | 2011-12 | 2012-13 | 2013-14 | |
|---|---|---|---|---|---|
| Number of water accounts (in thousand) | 2,750 | 2,770 | 2,800 | 2,820 | 2,860 |
| Number of water accounts liable to pay sewage charge (in thousand) | 2,550 | 2,570 | 2,590 | 2,610 | 2,640 |
| Number of Accounts - Trade Effluent Surcharge (TES) (in thousand) | 19.8 | 20.7 | 21.4 | 22 | 23 |
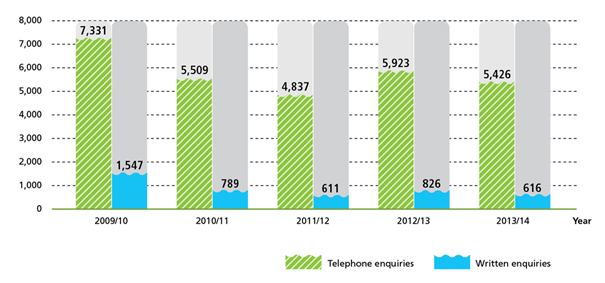
Number of Enquiries Received for the Past Five Years
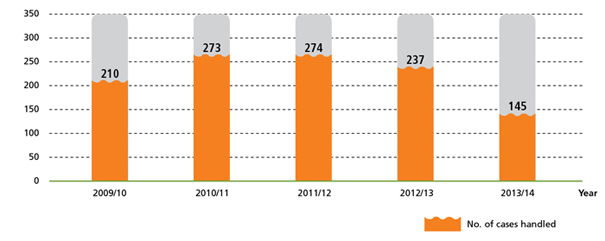
Number of Business Reclassification Applications Handled for the Past Five Years
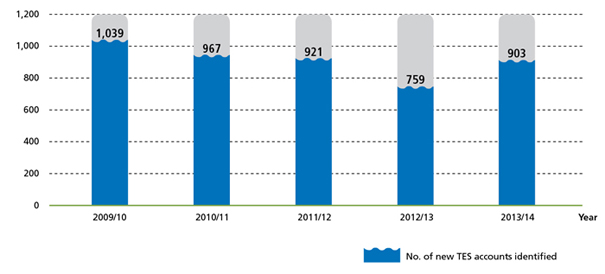
Number of New TES Accounts Identified for the Past Five Years
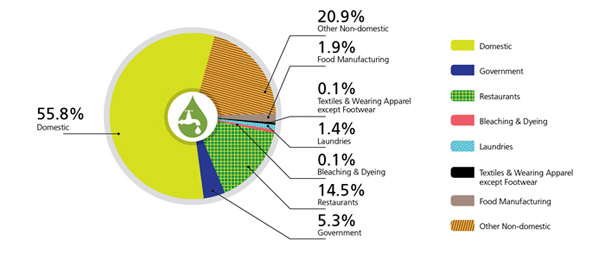
Water Consumption of Sewered Accounts (528 million m3) - Customers Pattern
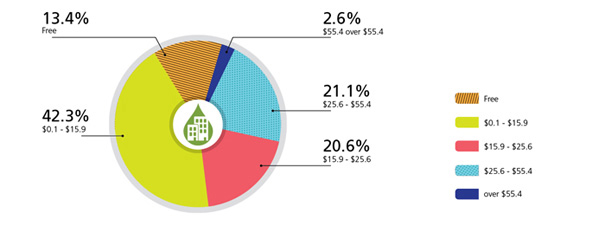
Domestic Accounts - Sewage Charge Payment Pattern (HK$/month)
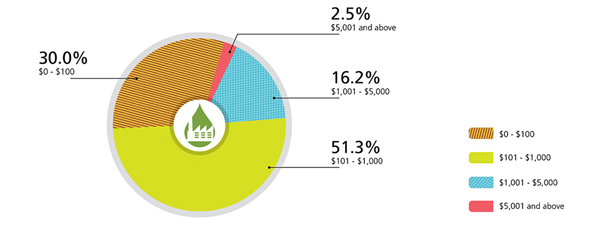
TES Accounts - TES Payment Pattern (HK$/month)
Sewage Charge (HK$875 M) - Revenue Pattern by Type
Note : The figures are provisional only and are subject to endorsement by the Sewage Services Accounts Committee.
Trade Effluent Surcharge (HK$221 M) - Revenue Pattern by Type
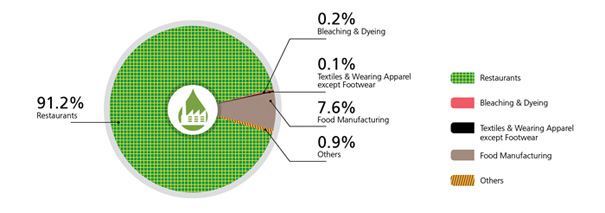
Note : The figures are provisional only and are subject to endorsement by the Sewage Services Accounts Committee.
Sewage Charge and Trade Effluent Surcharge (HK$1,096 M) - Revenue Pattern by Type
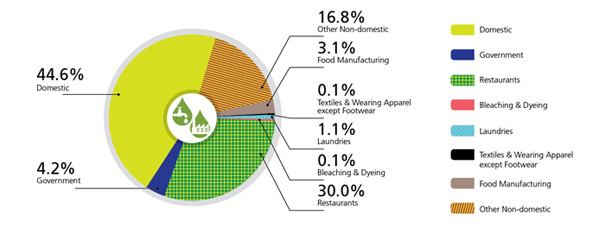
Note : The figures are provisional only and are subject to endorsement by the Sewage Services Accounts Committee.
| Unit | 2009-10 | 2010-11 | 2011-12 | 2012-13 | 2013-14 | |
|---|---|---|---|---|---|---|
| Flooding Prevention | ||||||
| Total Number of Flooding Blackspots | - | 18 | 16 | 15 | 13 | 11 |
| Sewage Treatment | ||||||
| Coverage of public sewerage (population percentage) | - | 93% | 93% | 93% | 93% | 93% |
| Total length of sewerage network | km | 1,622 | 1,637 | 1,647 | 1,683 | 1,695 |
| Total no. of sewage treatment facilities | - | 277 | 284 | 287 | 292 | 293 |
| Volume of Sewage Treated | in million m3 | 979 | 979 | 981 | 1,001 | 1,021 |
| By Preliminary Treatment | in million m3 | 287 | 293 | 286 | 306 | 303 |
| By Primary Treatment | in million m3 | 5 | 4 | 4 | 5 | 5 |
| By Chemically Enhanced Primary Treatment (CEPT) | in million m3 | 524 | 517 | 525 | 525 | 541 |
| By Secondary Treatment | in million m3 | 163 | 165 | 166 | 165 | 172 |
| By Tertiary Treatment | in million m3 | 0.09 | 0.13 | 0.13 | 0.2 | 0.15 |
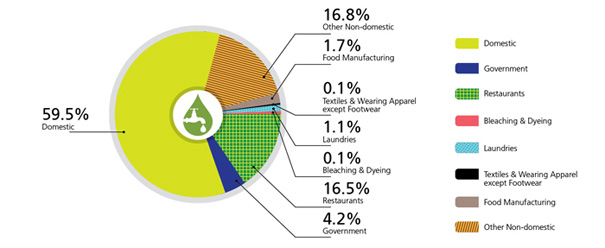
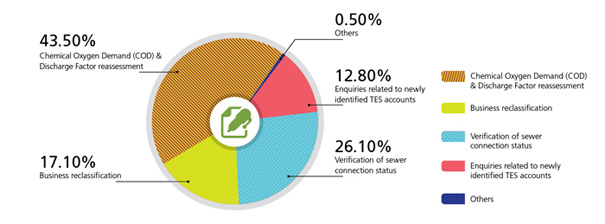
Written Enquiries Received in 2013-14 by Types
Procurement Practice
| Unit | 2013-14 | |
|---|---|---|
| Proportion of spending on locally-based suppliers at significant locations of operation | % | 98.8% |


