|

|
Appendix A >
Appendix B >
Appendix C >
Appendix D >
Appendix E >
Appendix F >
Appendix G >
Appendix H >
Appendix I
Consumption
and Payment Statistics for 2000/01
| Figure
H1 |
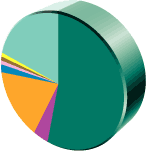
Water
Consumption of Sewered Accounts (487.4 M m3) - Customers |
 |
 |
Food
manufacturing 1% |
 |
Textiles
and wearing apparel except footwear 1% |
 |
Laundries
1% |
 |
Bleaching
& dyeing 2% |
 |
Restaurants
17% |
 |
Government
4% |
 |
Domestic
53% |
 |
Other
Non-domestic 21% |
|
| Figure
H2 |
Domestic
Accounts - Sewage Charge Payment Pattern ($/mth) |
 |
|
$32.4
and above 3% |
|
$15.1
- $32.4 22% |
|
$9.4
- $15.0 21% |
|
$0.1
- $9.3 38% |
|
Free
16% |
|
| Figure
H3 |
TES
Accounts - TES Payment Pattern ($/mth) |
 |
|
$5,001
and above 5% |
|
$1,001
- $5,000 23% |
|
$101
- $1,000 46% |
|
$0
- $100 26% |
|
| Figure
H4 |
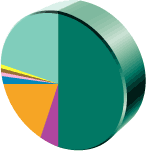
Sewage
Charge ($479.8M) - Revenue Pattern by Type |
 |
|
Food
manufacturing 1% |
|
Textiles
and wearing apparel except footwear 1% |
|
Laundries
1% |
|
Bleaching
& dyeing 2% |
|
Restaurants
16% |
|
Government
5% |
|
Domestic
50% |
|
Others
24% |
|
| Figure
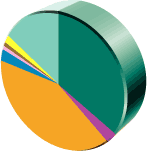
H5 |
Trade
Effluent Surcharge ($239.8M) - Revenue Pattern by Type |
 |
|
Food
manufacturing 3% |
|
Textiles
and wearing apparel except footwear 1% |
|
Laundries
1% |
|
Bleaching
& dyeing 4% |
|
Restaurants
90% |
|
Others
1% |
|
| Figure
H6 |
Sewage
Charge and Trade Effluent Surcharge ($719.6M) - Revenue Pattern by
Type |
 |
|
Food
manufacturing 2% |
|
Textiles
and wearing apparel except footwear 1% |
|
Laundries
1% |
|
Bleaching
& dyeing 3% |
|
Restaurants
41% |
|
Government
3% |
|
Domestic
33% |
|
Others
16% |
|
|