Chapter 8
Let's Contribute

The Sewage Charges are levied based on a “Polluter Pays Principle”. Out of 2.23 million domestic consumers, 75% pay less than HK$15 in sewage charges each month.


The Charges

Customer Enquiries

Reassessment of TES Rate and Discharge Factor

Business Reclassification

Billing and Consumption Statistics

Revenue and Expenditure


The Sewage Charging Scheme, introduced in April 1995, requires a polluter to pay for the cost of sewage services provided in accordance with the quality and quantity of wastewater discharged. To keep the charge at a modest level, the charges were set to recover only the operating and maintenance costs of the public sewage facilities, while the capital costs of building these facilities will continue to be borne by the Government.


Polluter pays

The Charges

The sewage charges contain two components; the Sewage Charge (SC) and the Trade Effluent Surcharge (TES). They are based on the volume of water consumed, but water supplied specifically for flushing purposes is excluded. Only premises that are connected to the public sewerage system are required to pay sewage charges. The SC aims at recovering the costs of collecting and treating sewage typically discharged from domestic premises. For each water account, a unit rate of $1.2/m3 of water supplied will be charged, irrespective of the type and nature of use of the premise. However, the first 12 m3 of water supplied to each domestic water account in each 4 monthly consumption period is exempted from paying SC. As most water consumers are required to pay the SC, it is included in the water and sewage charges bills issued by the Water Authority. For the ten trades, business and manufacturers listed in Table G1 of Appendix G, the amount of SC chargeable is based on 70% of the water supplied. The others are charged at 100% of the water supplied.


The TES aims at recovering the additional costs of treating trade effluent with pollution level higher than that of a domestic sewage. Under the Sewage Services Ordinance, 30 designated trades (as listed in Table G2 of Appendix G) are required to pay TES in addition to SC. The pollution level is indicated by the Chemical Oxygen Demand (COD) values such that the TES rates are based on the additional costs for treating the corresponding COD values in excess of the domestic COD. The TES rates and generic COD values for the thirty trades, businesses or manufactures are also listed in the Table. Currently, the TES rate ranges from $0.11/m3 to $5.98/m3 depending on the type of trade, business or manufacture being operated in the premises. For the eight trades, businesses and manufactures listed in Table G3 of Appendix G, the amount of TES chargeable is based on 80% of the water supplied. The others are charged at 100% of the water supplied. Bills for the TES are issued separately by the Drainage Services Department.


Customer Enquiries

In 2000/01, we received and provided satisfactory answers to over 7,600 telephone enquiries, 2,500 written enquiries and 270 personal enquiries at our service counters. Figure 8.1 shows the number of verbal and written enquiries received since April 1995. There was a slight increase in the number of enquiries since 1999/2000. This may be due to the increase in number of newly identified TES accounts and our stepped up actions to recover bad debts.

Verbal enquiries
Written enquiries

Figure 8.1 Number of enquiries received from customers since 1995


Figure 8.2 presents a breakdown by the types of written enquiries received in 2000/01. Similar to previous years, most of the written enquiries are related to billing matters. An initial written reply is issued within two working days to confirm receipt of the enquiry and to inform the customer that the necessary follow-up investigation work on the enquiry has already begun. In 2000/01, we continued to achieve the target of providing a full reply to customers within one month from the date of receipt of a written enquiry for 95% of the cases.


Enquiries related to newly identified TES accounts 15.7%
Matter related to water consumption 8.7%
Verification of sewer connection status 16.3%
Business reclassification 6.5%
COD & Discharge Factor reassessment 18.7%
Billing enquiries 29%
Others 5.2%
Figure 8.2 Written enquiries received in 2000/01 by types


Reassessment of TES Rate and Discharge Factor

Non-domestic consumers may apply for reassessment of the TES rate or discharge factor if they consider that the effluent strength or discharge factor of their discharge is lower than the corresponding values specified in the Ordinance. The discharge factor is the volume of water discharged as a percentage of the volume of water supplied. The number of applications for reassessment of TES rate has increased while that for the discharge factor has decreased this year as shown in Table 8.1. The distribution of applications for reassessment of TES rate (COD reassessment) in 2000/01 by business classification is shown in Table 8.2. The TES rate matrix is shown in Table G4 of Appendix G.

Charging Parameter Number of applications received in the year
1999/2000 2000/2001
Effluent Strength (COD) 406 549
Discharge Factor 37 35
Table 8.1 Number of applications for reassessment of TES rate and discharge factor in 1999/2000 and 2000/01


Trade Classification
No. of accounts applying for COD reassessment
Restaurants
441
Slaughtering, preparing and preserving meat
86
Food processing
8
Paper recycling
6
Soft drink/Breweries
4
Bleaching and dyeing
2
Dairy product
2
Total
549
Table 8.2 Distribution of COD reassessment applications in 2000/01 by business classification

Among all COD reassessment cases, 12 were withdrawn for either technical or logistic reasons and 54 cases were rejected. In 2000/01, 471 accounts had been successful in demonstrating that the pollution level of their effluent is lower than the generic effluent strength of their respective trades. More than 80% of the applications for COD reassessment had come from restaurant accounts. In addition, 35 consumers had demonstrated that their discharge factors are less than 85% of the values specified in the Regulations for the respective trades. Most discharge factor reassessment cases are related to SC only.


Business Reclassification

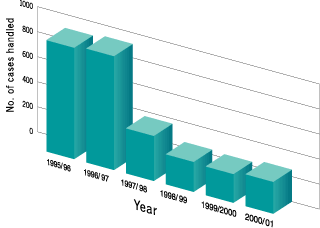
The business classification of a TES account is normally assigned according to that reported during the application for a water supply metre. If a customer has subsequently changed his/her business type or considers that the business classification assigned was incorrect, he/she should submit an application for review. The number of applications for business reclassification handled since April 1995 is shown in Figure 8.3. During the financial year 2000/01, 321 business reclassification cases were handled.

From time to time, some TES chargeable water accounts have not been registered because of incorrect business classifications in the water account records. Actions have been taken to identify business accounts which the law should pay TES but were not charged for TES in the past. In 2000/01, 630 new TES accounts were identified. The total numbers of accounts identified in the past years are shown in Figure 8.4.


Figure 8.3 Business reclassification applications handled since 1995

Figure 8.4 Number of new TES accounts identified since 1995


Billing and Consumption Statistics

There are about 2.43 million water accounts of which about 2.23 million are liable to pay SC. The department will determine whether a premise is connected to public sewerage and, therefore, liable to pay SC while the Water Authority will handle the maintenance of account details and billing matters on our behalf. About 16,200 corrections were made to the sewer connection status of the accounts in 2000/01.

In the non-domestic category, about 14,800 accounts are liable to pay TES as they operate one of the 30 trades designated in the Sewage Services (TES) Regulation. The distribution of TES accounts by trade types is shown in Figure 8.5.

In 2000/01, about 61,300 TES bills were issued, including 692 bills for newly identified accounts. We have also processed 157 applications for payment by auto-pay and 141 by monthly instalments.

Since April 1998, we have stepped up actions to recover bad debts. For active accounts, recovery actions include issuance of reminders and water disconnection orders to the account holders. In 2000/01, about 1,200 disconnection orders were issued and as a result $4.4 million was recovered.


For closed accounts with default payment, an action plan on recovering debts was formulated and implemented accordingly. In 2000/01, over $1.8 million was recovered from these accounts. The statistics on water consumption, payment, and contributor patterns in relation to the charges are shown in Appendix H.


Laundries 5.7%
Textiles and wearing apparel except footwear 14%
Food manufacturing 5.7%
Bleaching & dyeing 0.7%
Restaurants 71.7%
Others 2.2%
Figure 8.5 Distribution of TES accounts by trade types in 2000/01


Revenue and Expenditure

The revenue and expenditure in the Sewage Services Operating Accounts from 1995 to 2001 are summarized in Table 8.3. The account for the year ended March 31, 2001 is shown in details in Appendix I.

The total revenue from SC and TES has been quite steady in the past years, mainly because the level of charges has remained static since the introduction of the charging scheme. On the other hand, the overall expenditure has increased significantly in the period mainly due to newly completed sewerage infrastructures coming into operation. As a result, the deficit of the sewage services operating account has been growing every year since 1996/97.

1995/96
1996/97
1997/98
1998/99
1999/2000
2000/01
Sewage Charge Revenue ($M)
427
469
476
472
478
480
TES Revenue ($M)
274
227
266
241
235
240
Other Revenue ($M)
14
24
27
31
26
29
Overall Revenue ($M)
715
720
769
744
739
749
Overall Expenditure ($M)
(639)
(723)
(879)
(1,110)
(1,352)
(1,376)
Balance ($M)
76
(3)
(110)
(366)
(613)
(627)
Table 8.3 Summary of Sewage Services Operating Accounts since 1995