 |
| Home | The Director's Statement | Our Vision, Mission and Values | Highlights of the Year |
|
| Overview | Ready for the Rainy Days | Let's Clean Up Our Water | Environmental Performance | Let's Contribute |
|
Let's Contribute - Introduction |
|
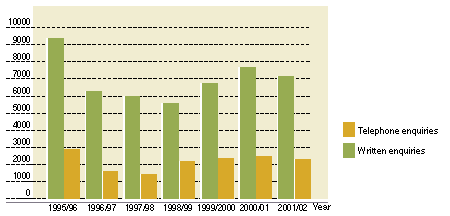
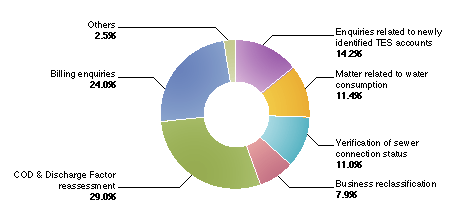
Reassessment of TES Rate and Discharge Factor Non-domestic consumers may apply for reassessment of the TES rate or discharge factor if they consider that the effluent strength or discharge factor of their discharge is lower than the corresponding values specified in the Ordinance. The discharge factor is the volume of water discharged as a percentage of the volume of water supplied. The number of applications for reassessment of both the TES rate and the discharge factor has increased this year as shown in Table 5.1. The distribution of applications for reassessment of TES rate (COD reassessment) in 2001/02 by business classification is shown in Table 5.2.
Among all COD reassessment cases, 26 were withdrawn for either technical or individual reasons and 41 cases were rejected. In 2001/02, 576 cases had been successful in demonstrating that the pollution level of their effluent is lower than the generic effluent strength of their respective trades. More than 80% of the applications for COD reassessment had come from restaurant accounts. In addition, 47 cases had demonstrated that their discharge factors are less than 85% of the values specified in the Regulations for the respective trades. Most discharge factor reassessment cases are related to sewage charge (SC) only. |
|||||||||||||||||||||||||||||||
| Business Reclassification
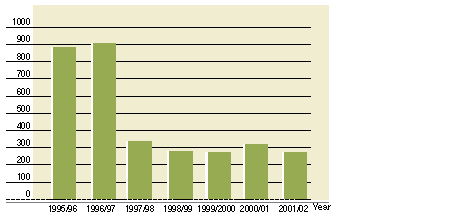
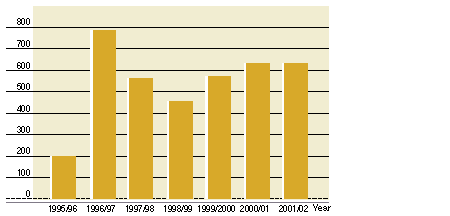
The business classification of a TES account is normally assigned according to that reported during the application for a water metre. If a customer has subsequently changed his/her business type or considers that the business classification assigned was incorrect, he/she should submit an application for review. The number of applications for business reclassification handled since April 1995 is shown in Figure 5.3. In 2001/02, 273 business reclassification cases were handled. From time to time, some TES chargeable water accounts have not been registered because of incorrect business classifications in the water account records. Actions have been taken to identify business accounts which according to the law should pay TES but were not charged for TES in the past. In 2001/02, 633 new TES accounts were identified. The total numbers of accounts identified in the past years are shown in Figure 5.4.
|
|
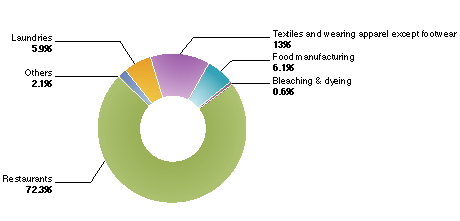
Billing and Consumption Statistics There are about 2.49 million water accounts of
which about In the non-domestic category, about 15,400 accounts are liable to pay TES as they operate one of the 30 trades designated in the Sewage Services (TES) Regulation. The distribution of TES accounts by trade types is shown in Figure 5.5. In 2001/02, about 62,700 TES bills were issued, including 684 bills for newly identified accounts. We have also processed 149 applications for payment by auto-pay and 128 by monthly instalments. Since April 1998, we have stepped up actions to recover bad debts. As at 31 March 2002, there are 888 active accounts with overdue amount of $5.3 million. The recovery actions include issuance of reminders and water disconnection orders. In 2001/02, about 1,400 disconnection orders were issued and as a result $5.6 million was recovered. For closed accounts with default payment, an action plan on recovering debts was formulated and implemented accordingly.As at 31 March 2002, there are 1,218 closed accounts with overdue of $17.2 million. In 2001/02, about 1,000 letters before legal action were issued and about 100 cases had been referred to Department of Justice for legal action. As a result, over $1.8 million was recovered from overdue closed accounts. The statistics on water consumption, payment, and contributor patterns in relation to the charges are shown in Appendix G.
|
|
The revenue and expenditure in the Sewage Services Operating Accounts from 1995/96 to 2001/02 are summarized in Table 5.3. The account for the year ended March 31, 2002 is shown in details in Appendix H. The total revenue from SC and TES has been quite
steady in the past years, mainly because the level of charges has
remained static since the introduction of the charging scheme. In
2001/02, as a result of the settlement of the contractual disputes
of the sewer tunnel contracts, $750 million due from the contractors
was included as other revenue. Taking away this amount, the overall
revenue would be lower than that in the previous years. This is
mainly due to the effect of the concessions for SC and TES as announced
in the 2002 Budget Speech. On the other hand, the overall expenditure
has increased by $95 million in 2001/02 as compared with 2000/01
due to newly completed sewerage infrastructures coming into operation.
As a result, the deficit of the sewage services operating account
was $33 million in 2001/02.
*It includes the mediation settlement of $750 million relating to the contractual disputes between the Government and the sewer tunnel contractors. |